Goal: The goal is to increase overall new residential density
This indicator tracks the density of residential dwelling units added to the city each year compared with average net density of all existing residential properties in the city. This measure is important because it gets to the heart of the PlanCOS density vision by answering whether or not new developments are contributing positively to density. This measure is intended to account for most types of added units including those in established and newly developing areas. Because only residential parcels are included in the analysis, this net measurement approach will largely avoid concerns with accounting for other uses of property including non-residential buildings, street right-of-way and parks and open space. This indicator is intended primarily to be used as a citywide measure but may also be used to track activity and progress in priority areas identified by the City.
Table: Net Density of New Residential Development
| 2016 | 2017 | 2018 | 2019 | 2020 | |
|---|---|---|---|---|---|
| Number of New Units | 3586 | 3230 | 3585 | 3220 | 4561 |
| Acres of Property with New Units | 383.8 | 401.3 | 426.3 | 400.6 | 508.6 |
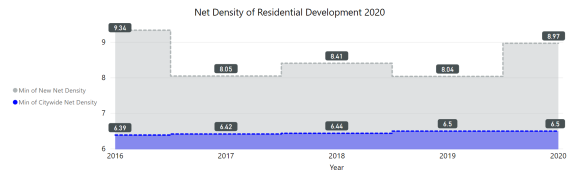
| New Net Density | 9.34 | 8.05 | 8.41 | 8.04 | 8.97 |
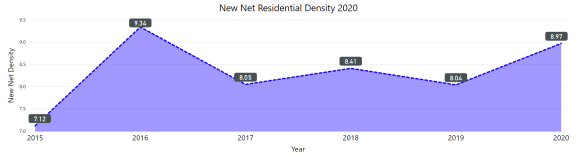
Table: Net Density of All Residential Development
| 2016 | 2017 | 2018 | 2019 | 2020 | |
|---|---|---|---|---|---|
| Number of Units | 194,082 | 197,312 | 200,897 | 204,117 | 208,678 |
| Acres of Property with Residential Units | 30,350.58 | 30,751.88 | 31,178.2 | 31,578.78 | 32,087.38 |
| A;; Net Density | 6.39 | 6.42 | 6.44 | 6.5 | 6.5 |
Source: Assessor's data, combined with building permit data.
For more information about this indicator, visit Appendix F: Keystone Indicators.